2022 Auto Insurance Trends Report: Part I
Who’s Paying More for Coverage
Written by
Chase Gardner
Data Journalist
Chase Gardner is a data journalist at Insurify. He informs readers on major developments in the auto and home industries through research into driver behavior, homeownership tendencies, cost of living trends, and more. He received a bachelor’s degree with concentrations in Environmental & Urban Studies and Statistics from the University of Chicago. Chase’s work has been cited in MSN, Yahoo News, The Street, and dozens of local news outlets across the country.
Edited by
Tanveen Vohra
Editorial Manager
Tanveen Vohra is an editorial manager at Insurify specializing in writing about property and casualty insurance. Through her work, Tanveen helps consumers better understand the components of their insurance policies so they can make smarter purchase decisions.Tanveen's work has been cited by CNBC , Fox Business, Business Insider, Fortune, and Market Watch, among others.
Reviewed by
Andrew Huang
Director of Analytics
Andrew leads data analysis at insurify.com, and he has formerly led data analysis projects at kayak.com and realtor.com. Andrew strives to help people save money on their insurance, and in his free time he loves finding great deals on travel flights. Insurify's network bidding algorithms and Kayak's flight trends are personal favorite projects.
Fact checked by
Betsy Stella
VP of Insurance Partnerships
Betsy Stella is the vice president of insurance partnerships at Insurify. Before coming to Insurify, she spent more than 20 years in distribution, operations, and sales at Farmers Insurance. She leverages her extensive industry experience to provide general audiences with clear, accurate, and up-to-date information on all aspects of the insurance shopping process.
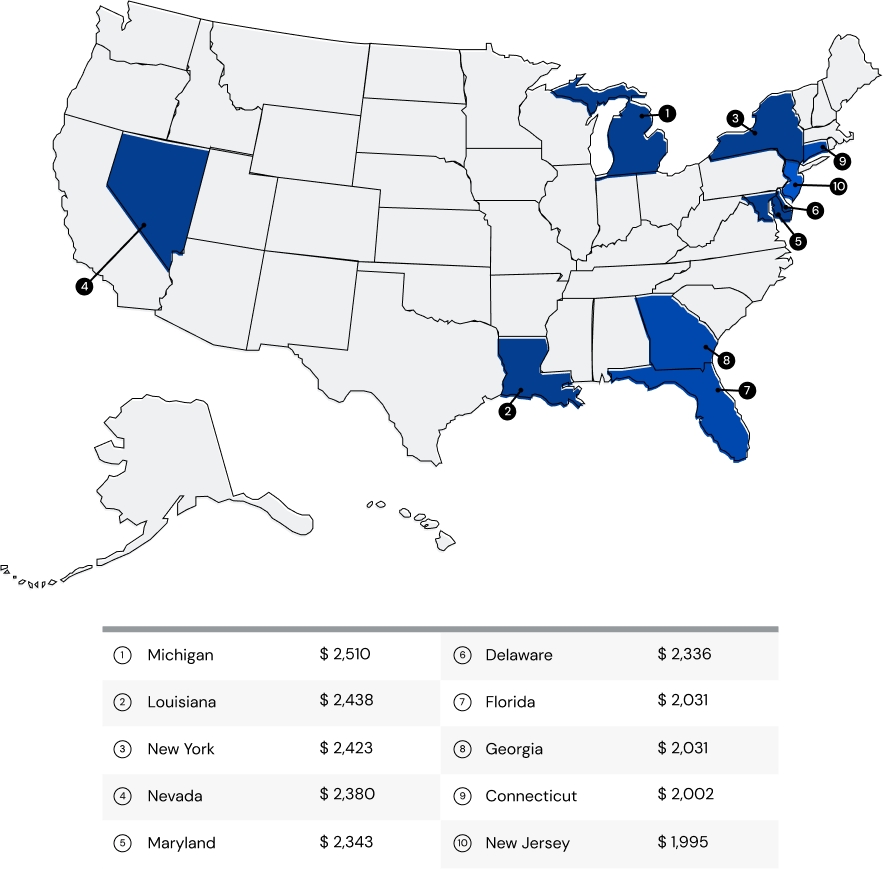 Average yearly insurance premium
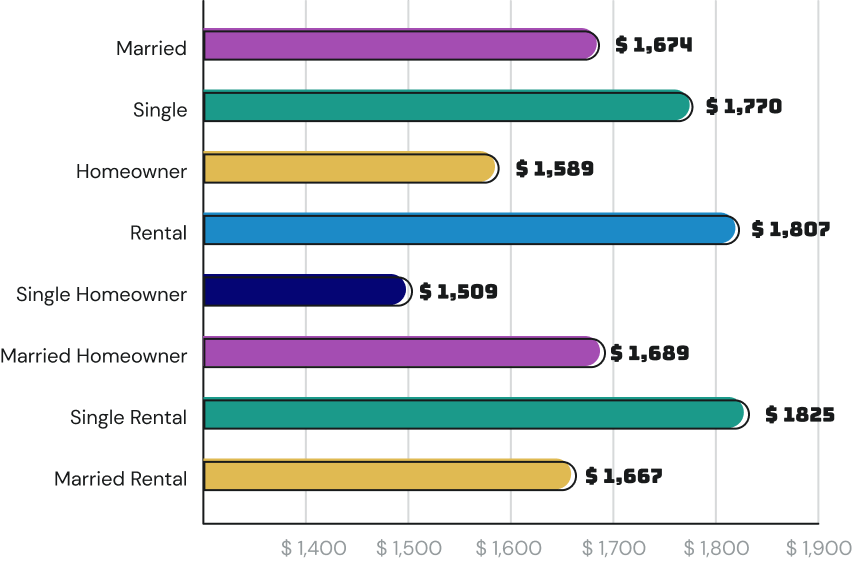
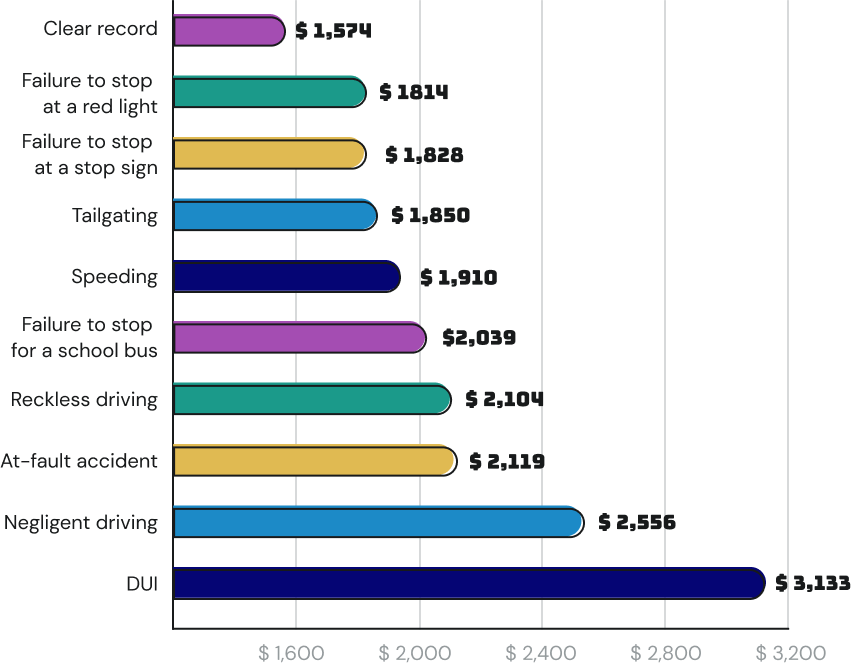 Average yearly insurance premium


