Natural Disaster Statistics: The Most Remarkable Data

JJ Starr
Written by
JJ Starr
Photo of an Insurify author
Written by
JJ Starr
Insurance Writer
J.J. Starr is a health and finance writer with a background in banking, lending, and financial advising. She holds a Series 6, FINRA, and life insurance licensure and a master's degree from New York University. Through her writing, she strives to use her decade of experience to help consumers make sound financial choices. Connect with J.J. on LinkedIn.
John Leach
Edited by
John Leach
Photo of an Insurify author
Edited by
John Leach
Insurance Content Editor at Insurify
John Leach is an insurance content editor who has worked in print and online. He has years of experience in car and home insurance and strives to make these topics easy to understand for everyone. He has a linguistics degree from UC Santa Barbara.

Updated August 4, 2021

Reading time: 12 minutes

Why you can trust Insurify: As an independent agent and insurance comparison website, Insurify makes money through commissions from insurance companies. However, our expert insurance writers and editors operate independently of our insurance partners. Learn more.

Extreme weather and geological events happen across the globe. But the United States is especially prone to natural disasters— from hurricanes on the east coast to the wildfires of the west. To make matters worse, the frequency and severity of some natural disasters appear to be on the rise.

Preparing for a natural disaster can come in many forms, but the most important thing any homeowner should do is ensure their home insurance will cover the types of natural disasters most common in their area.

What Is A Natural Disaster?

Not all inclement weather and geophysical events are categorized as natural disasters. To be designated a disaster— in insurance industry jargon it’s called a catastrophe — the event must cause a significant amount of harm to people, property, or both.

  • - Aon— a professional services firm specializing in financial-risk mitigation— defines a catastrophe as a natural event that causes any one of the following:

    • - 10 or more deaths

    • 50 or more injuries

    • 2,000 or more property claims filed

    • 2,000 or more structures damaged

    • $25 million or more in property loss (III)

  • A declared disaster is a designation determined by the Federal Emergency Management Agency (FEMA). There are two types of declarations: emergency declarations and major disaster declarations. Both allow the President to give financial and operational assistance to affected areas. (FEMA.gov)

  • Anticipated loss can be grounds for an individual insurance company to declare a “catastrophe.” The loss must be anticipated to affect policyholders in the impacted area. (RMIIA.org)

  • When an insurance company declares a catastrophe, it will likely also establish emergency claims processing centers, 24-hour hotlines, and additional resources for policyholders in the affected area. It usually also sends specially trained claims adjusters to the location as soon as it is safe to do so. (RMIIA.org)

  • The last time disaster relief legislation was updated was November 23, 1988, with the signing of the Robert T. Stafford Disaster Relief and Emergency Assistance Act. This amended and expanded the Disaster Relief Act of 1974. (FEMA.gov)

What Causes A Natural Disaster?

Natural disasters come in many forms. Some areas are more prone to certain natural disasters than others. For example, the Rocky Mountain area of the U.S. won’t experience earthquakes, but forest fires and flash flooding are significant risks. Meanwhile, the midwest is less prone to forest fires, but more prone to extreme thunderstorms and tornadoes.

  • Thunderstorms are caused when warm, moist air encounters cold, dry air above it. The warm air pushes the cold air upward due to differences in density. This creates a thunderstorm cloud. (SciJinks)

  • Like thunderstorms, hurricanes are formed when the warm, moist air just above the ocean’s surface interacts with the cooler air above it. The warm air is pushed upwards, creating a column of clouds with an area of low pressure beneath it. The surrounding air rushes into the low-pressure area, creating wind. The infamous twisting around the eye of the hurricane is caused by the storm’s interaction with the earth’s rotation and can only happen between five and 15 degrees of latitude from the earth’s equator on both sides. (The Telegraph)

  • Storm surge — the most dangerous part of any hurricane— is the bulge of water that builds at the front of the hurricane. It is caused by thrust from the hurricane’s winds. (National Geographic)

  • Flash flooding occurs when the ground cannot absorb rainfall faster than a storm’s precipitation. This can happen in cities, where the sewer systems are not able to drain city streets. But this can also happen in natural landscapes, especially where the water tables are already high. Frequently, valleys in mountainous areas are prone to flooding from heavy rainfall. (The Weather Channel)

  • An earthquake is caused by movements between tectonic plates. The natural slipping of one plate on a fault line causes the tremors and shakes that ripple through the earth’s crust. This slipping happens because the two plates are in constant friction with each other. As one tectonic plate slips, the tension is released causing an earthquake. (USGS.gov)

What’s The Cost Of Natural Disasters?

To be designated a natural catastrophe by economic losses alone, a natural disaster must cause at least $25 million in economic damages. However, many natural disasters have larger economic impacts.

  • Since 1980, the total cost of 291 weather and climate disasters totals more than $1.9 trillion in 2021 dollars. (National Climatic Data Center, NCDC)

  • Wildfires in California in 2020 cost more than $10 billion. (GoBankingRates.com)

  • 2017 was a record-breaking year for natural disaster loss. The total cost of catastrophe losses as reported by the property and casualty insurance industry was $101.9 billion. In 2018, it was $47.5 billion. Catastrophic events included Hurricane Harvey, Hurricane Maria, and massive wildfires in California. (RMIIA)

  • In 2019, the total damages from catastrophe losses totaled $39.6 billion. (RMIIA)

  • In 2020, the total damages from catastrophe losses totaled $74.4 billion. (RMIIA)

  • In May 2014, a spate of severe storms caused more than $2.9 billion in insured losses from Colorado to Pennsylvania over the course of five days. (RMIIA)

  • As of April 8, 2021, there’s been only 1 natural disaster with losses of more than $1 billion. (NCDC)

How Common Are Natural Disasters?

Natural disasters occur every year in all regions of the United States. In fact, the U.S. records more natural disasters than any other nation except China. With events, you’re most at risk to depends on the natural hazards in your area.

  • In the U.S., around 10% of thunderstorms are severe. That means that the storms include wind speeds of more than 57.5 miles per hour, hail fall or one inch or more, and/or a tornado. (Statista)

  • The U.S. has more natural disasters than most countries. It is second only to China. (Statista)

  • The average number of natural disasters over the last five years is 16.2. (NCDC)

  • Most U.S. natural disasters are meteorological (contributed to weather). Examples include blizzards, hailstorms, thunderstorms, hurricanes, droughts, heatwaves, and tornadoes. (Statista)

  • Between 1900 and 2016, approximately 106 hurricanes hit the U.S. (Statista)

  • Between 1900 and 2016, 40 earthquakes and 2 tsunamis impacted the U.S. (Statista)

Are Natural Disasters On The Rise?

Due to changes in our climate— mainly a warming climate— extreme weather events do appear to be happening more frequently and at greater intensity. Additionally, some areas are seeing more intense changes to the natural weather patterns. For example, tornado activity has been especially on the rise in the Southeast.

  • The frequency and cost of natural disasters are both on the rise in the United States. However, this is due to a number of reasons. First, there is increased exposure to natural disaster risks as human settlement spreads into previously unsettled areas. Second, increased temperatures have created more opportunities for meteorological events like thunderstorms and hurricanes. (Climate.gov)

  • While increases in natural disaster events and costs haven’t been in a straight line, the evidence is clear that the overall trend shows natural disasters are increasing in frequency and severity. (Climate.gov)

  • From 1980 to 2020, the average number of natural disasters was 7 per year with an average annual cost of $45.7 billion. (Climate.gov)

  • In the last ten years, the average number of natural disasters was 13.5 per year with an average annual cost of $89 billion. (Climate.gov)

  • In the last five years, the average number of natural disasters was 16.2 per year with an average annual cost of $121.3 billion. (Climate.gov)

  • In 2020, a record-breaking 22 natural disasters struck the U.S. (NCDC)

  • 2020 was the sixth consecutive year with 10 or more billion-dollar weather and climate events occurred in the U.S. (NCDC)

  • Since 1980, there have been 11 years where billion-dollar disaster events totaled 10 or more annually. These are 1998, 2008, 2011-2013, and 2015-2020. (NCDC)

  • Loss estimates for six of the 14 billion-dollar events in 2019 have likely been underestimated. This is due to two factors: there has been less coverage of insured assets (more uninsured property has been damaged), and there is still data to be collected. (NCDC)

  • Due to the world’s population and infrastructure growth, human exposure to natural disasters is increasing. (Disaster-survival-resources.com)

  • The strongest population growth is around coastal areas where there is an increased risk of flood, hurricanes, and tidal waves. (Disaster-survival-resources.com)

  • There is also continued population growth in high-risk areas such as flood plains and steep slopes. (Disaster-survival-resources.com)

  • Colorado has seen the largest increase in claims payments, up 179% from 2009 to 2013 from the previous 12 years. (RMIIA)

Climate Change

The rise in severe weather has often been linked to climate change. Rising temperatures have been linked to more severe droughts and wildfires in some areas, while other areas experience more frequent storms and heavier precipitation.

  • Wildfires are considered a symptom of climate change due to increasing temperatures. (NASA)

  • Hurricanes are likely becoming more frequent and severe due to climate change. (Statista)

The Costliest and Deadliest Natural Disasters In Us History

As natural disasters have become more frequent and more costly, the death tolls associated with them have gone down. This is due to earlier detection in the case of weather events, plus better preventative measures, such as earthquake-resistant buildings.

  • - The most deadly natural disasters in U.S. History:

    • 1. Storm (September 8, 1900 – 6,000 Fatalities)

    1. Earthquake (April 18, 1906 – 2,000 Fatalities

    2. Storm (September, 1928 – 1,836 Fatalities)

    3. Storm (August 29, 2005 – 1,833 Fatalities)

    4. Extreme Temperature (June 1980 – 1,260 Fatalities)

    5. Extreme Temperature (July 1936 – 1,193 Fatalities)

    6. Wildfire (October 15, 1918 – 1,000 Fatalities)

    7. Storm (March 17, 1925 – 739 Fatalities)

    8. Storm (March 1913 – 732 Fatalities)

    9. Extreme Temperature (July 14, 1995 – 670 Fatalities) (Statista)

  • The most expensive natural disasters in the U.S. (in 2020 dollars):

    • 1. 2005, Hurricane Katrina   $86,570

    1. 2012, Hurricane Sandy  33,930

    2. 2017, Hurricane Harvey 31,960

    3. 2017, Hurricane Irma  31,840

    4. 2017, Hurricane Maria  31,300

    5. 1992, Hurricane Andrew  29,700

    6. 1994, Northridge earthquake 27,370

    7. 2008, Hurricane Ike  21,760

    8. 2012, Drought loss 16,610

    9. 2005, Hurricane Wilma   14,010 (III)

  • In 2019, winter storms and cold waves caused 73 of the 180 fatalities that year. Unlike most years, there were no deaths due to tropical cyclones. (Statista)

  • However, in 2019 severe thunderstorms caused more economic damage than flooding, winter storms, and geophysical disasters combined. (Statista)

  • Overall, severe thunderstorms tend to pose the most risk to public safety than any other natural disaster. (Statista)

  • At 6.3 on the Richter scale, the Northridge Earthquake in 1994 is the worst on record. It caused the deaths of 60 people, 12,000 injuries, and destroyed 8,000 homes. (Statista)

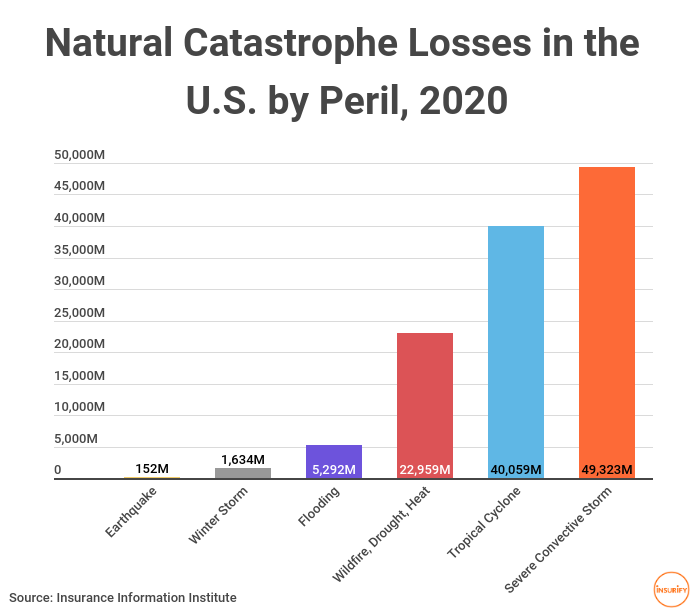
Natural Disasters By Type Of Disaster

There are many disaster types. The most common cause of a natural catastrophe is flooding, which can be caused by thunderstorms, hurricanes, or just heavy rainfall.

Natural Disaster Statistics for Droughts

Droughts have been on the rise over the last 20 years. A drought is defined as a period of time where an area receives less rainfall than normal.

  • - Drought was the cause of more than $8 billion in damages in 2011. (Statista)

Natural Disaster Statistics for Earthquakes

While large earthquakes are rarer than windstorms, they still pose a significant risk to areas near geological fault lines.

  • Typically, more than 2,000 earthquakes occur every year in the U.S. (Statista)

  • More than 1,475 earthquakes (out of 3,685) registering between 3.0 and 3.9 on the Richter scale hit the U.S. in 2005. (Statista)

  • Alaska has frequent strong earthquakes, with 12,053 recorded between 1974 and 2003. (Statista)

  • In 1906, San Francisco suffered a large earthquake that killed 2,000 people and caused structure fires across the city. (Statista)

  • The 1994 earthquake in Los Angeles caused about $30 billion in damage. It is the costliest earthquake to date in the U.S. (Statista)

Natural Disaster Statistics for Extreme Cold Events

Extreme cold events are most deadly when they occur in areas not prepared for cold weather. In 2021, an extreme cold event occurred in Texas, a state known for more mild winters.

  • In 1977, a wave of cold weather hit the eastern part of the U.S. and caused about $2.8 billion in damages. (Statista)

  • In 1993, one blizzard cost $5 billion in losses and killed 138 people. (Statista)

Natural Disaster Statistics for Extreme Heat Events

Extreme heat events tend to be most consequential for people without access to air conditioning. Often the elderly and the poorest Americans are most at risk during a heatwave.

  • In 2019, extremely hot weather accounted for more than $1.5 million in damages across the U.S. and caused 165 injuries. (Statista)

  • From 1900 to 2016, at least 24 heatwaves have affected the U.S.  (Statista)

  • The 1901 heatwaves caused the deaths of approximately 9,500 people and countless livestock. In New York alone, 250 horses died within one day of extreme heat. (WorldAtlas.org)

  • The heatwave in Kansas City, Missouri killed approximately 1,260 people in 1980.  (Statista)

  • The Chicago heat wave in 1994 killed 739 people. (University of Chicago)

  • In the 2021 heatwave in the Pacific Northwest, at least 112 people have died. (Associated Press)

  • Millions of shellfish were boiled alive in the 2021 heatwave in the Pacific Northwest. (People Magazine)

Natural Disaster Statistics for Floods

Floods can happen in every state across the country but are most common in the eastern half of the U.S.

  • Flooding is the most common naturally-caused property damage in the U.S. However, most homeowners policies do not cover flood damage. (RMIIA)

  • In 2019 alone, floods caused about $3.75 billion in damages and claimed the lives of 92 Americans. (Statista)

  • One flood in the Midwest in 2008 affected about 11 million people, killed 11 people, and cost more than $5 billion in damages to property and farmland. (Statista and National Weather Service)

  • Cars and vehicles are covered for floods only if the owner purchases comprehensive auto coverage. Even then, they should confirm that their policy includes flood coverage. (RMIIA)

Natural Disaster Statistics for Hurricanes

Hurricanes are often the most costly disaster in any given year. Heavy rains and storm surge cause flash floods that ruin property and claim lives. While preparedness measures, like levees, have reduced the impact of hurricanes, their failures have also caused destruction— like the levee failures during Hurricane Katrina.

  • Hurricane Irene affected more than 37 million people, caused the death of 58 people, and caused $14.2 billion in damages in 2011 (Statista)

  • Hurricane Sandy killed 233 people and cost approximately $68.7 billion in damages in 2012.  (Statista)

  • Hurricane Katrina is the worst hurricane on record both in economic loss and loss of life. It caused the deaths of 1,836 people and caused $125 billion in damages in 2005— approximately $170 billion in 2020 dollars. (Statista)

  • 18 North Atlantic tropical cyclones (tropical depressions, tropical storms, and hurricanes) hit the U.S. in 2019. (Statista)

  • 13 hurricanes made landfall in the U.S. between 2011 and 2019. (Statista)

  • Tropical cyclones caused more than $24.1 billion in damages in 2019, but there were no fatalities. (Statista)

  • From 1963 to 2012, storm surge is the leading cause of death due to tropical cyclones. That’s followed by rain, surf, offshore, wind, and tornado activity. (Statista)

Natural Disaster Statistics for Thunderstorms

Thunderstorms cause several hazards to people— lightning strikes, wind-carried projectiles, and structural collapse are just three common ways thunderstorms cause hazards to human life.

  • 70 people were killed and 100 injured by lightning in 2018. (Statista)

  • Lightning accounted for 76,860 insurance claims in 2019. (Statista)

  • 49 severe thunderstorms struck the U.S. in 2019 and caused $27 billion in damages. (Statista)

  • On average, severe thunderstorms cause more damage than any other type of natural disaster. (Statista)

Natural Disaster Statistics for Tornadoes

Tornadoes are common east of the Rocky Mountains where the cold front from the Rockies and Canada meets the warm front from Mexico and the Southwest. In recent years, this meeting point has shifted eastward.

  • Tornadoes are more common in the U.S. than in any other country. (Statista)

  • 971 tornadoes hit the U.S. in 2016. (Statista)

  • 1,248 tornadoes hit the U.S. in 2020. (Statista)

  • Tornadoes tend to touch down east of the Rocky Mountains. The “Tornado Alley” of the U.S. stretches through Texas, Oklahoma, Kansas, and Nebraska, and hosts the most tornadoes historically. (Statista)

  • Due to climate change, “Tornado Alley” is moving eastward. Fewer tornadoes are hitting the traditional states, while more are hitting the Southeastern portion of the U.S. (TheWeatherNetwork.com and NOAA)

  • Tornado season runs from March to August. Most tornadoes occur within these months. (Statista)

  • Tornadoes accounted for $320 million in damages in the U.S. in 2015. (Statista)

  • In 2019, tornadoes caused $3.1 billion in damages and 42 fatalities. (Statista)

  • On average, 1,000 tornadoes hit the U.S. each year. (Statista)

Natural Disaster Statistics for Wildfires

Wildfires are on the rise in most states with significant forest land in the U.S. Over the last ten years, the rise in wildfire frequency and intensity has dominated summer and fall headlines.

  • In 2016, approximately 68,000 wildfires burned 5.5 million acres in the United States. The total cost for fire suppression in 2016 was more than $1.9 billion. (National Interagency Fire Center, NIFC and Bankrate.com)

  • In 2017, approximately 71,000 wildfires burned 10 million acres in the United States. The total cost for fire suppression in 2017 was more than $2.9 billion. (NIFC and Bankrate.com)

  • In 2018, approximately 58,000 wildfires burned 8.8 million acres in the United States. The total cost for fire suppression in 2018 was more than $3.1 billion. (NIFC and Bankrate.com)

  • In 2019, approximately 50,000 wildfires burned 4.6 million acres in the United States. The total cost for fire suppression in 2019 was more than $1.5 billion. (NIFC and Bankrate.com)

  • The 2019 Camp Fire alone caused more than 10.6 billion in insured losses. (Statista)

  • In 2020, approximately 58,000 wildfires burned 10.1 million acres in the United States. The total cost for fire suppression in 2020 was more than $2.2 billion. (NIFC and Bankrate.com)

Methodology & Sources

Statistics from the following institutions were incorporated onto this page: Statista, FEMA, RMIIA, SciJinks, The Telegraph, National Geographic, The Weather Channel, USGS, NCDC, GoBankingRates.com, Climate.gov, Disaster-survival-resources.com, NASA, WorldAtlas.org, Associated Press, People Magazine, National Weather Service, TheWeatherNetwork.com, NOAA, National Interagency Fire Center, University of Chicago, and BankRate.com.

Data Attribution: The information, statistics, and data visualizations on this page are free to use; we simply ask that you attribute any full or partial use to Insurify through a link to this page.

Compare Home Insurance Quotes Instantly

  • Personalized quotes in 5 minutes or less
  • No signup required
JJ Starr
Written by
JJ Starr
Linkedin

Insurance Writer

J.J. Starr is a health and finance writer with a background in banking, lending, and financial advising. She holds a Series 6, FINRA, and life insurance licensure and a master's degree from New York University. Through her writing, she strives to use her decade of experience to help consumers make sound financial choices. Connect with J.J. on LinkedIn.

Learn More
John Leach
Edited by
John Leach

Insurance Content Editor at Insurify

Photo of an Insurify author
Edited by
John Leach
Insurance Content Editor at Insurify
John Leach is an insurance content editor who has worked in print and online. He has years of experience in car and home insurance and strives to make these topics easy to understand for everyone. He has a linguistics degree from UC Santa Barbara.