For the most part, insurance costs are going up in the United States. This is due to a number of factors. While the costs related to insurance claims fluctuate every year, especially depending on the occurrence of severe weather events, the overall trend is increasing.
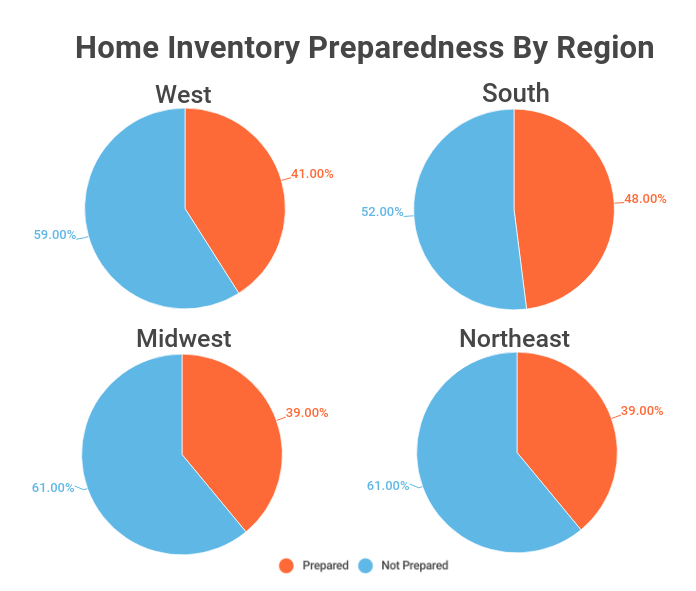
Where you live has a lot to do with the perils you face. Some regions see much higher home insurance premiums due to the increased risk. And in many areas the number of claims has been on the rise for the last several years.
Parts of the country that have frequent violent storms and tornadoes tend to also have some of the most expensive home insurance premiums. This area is often referred to as “Tornado Alley” and is located in eastern Colorado, northern and western Texas, Oklahoma, Kansas, Nebraska, and South Dakota. The average home insurance premium is $1,312 annually. (BankRate)
States with a small number of severe weather events tend to have lower home insurance premiums. However, other factors can influence costs. (BankRate)
Crime rates can play a large role in assessing the cost of home insurance premiums. Crime rates are calculated by ZIP code. (BankRate)
The state with the lowest annual premiums for homeowners insurance is Hawaii at $376 a year. This is because Hawaii law requires that homeowners purchase a separate policy to cover hurricanes, which occur at a lower rate than in the Gulf states. (BankRate)
Cost increases from hurricane risk can vary significantly by location. For example, homes in coastal South Carolina come with much higher premiums than homes only a few miles inland. (BankRate)
California experiences more home insurance losses than any other state due in large part to recent trends regarding wildfires. $12 billion in 2017 and $13 billion in 2018. (Policygenius)
From 2015 to 2019, California saw insured losses totaling on average $10.7 billion a year. That’s 40% higher than the next state, Florida, and larger than the combined losses of the 29 states with the least amount of insured losses for residential property. (Policygenius)
Florida counted 6,821 lightning claims that resulted in $93.2 million in insured losses, making it the state with the most lightning claims in 2019. (Policygenius)
More than 2 million homes are in designated high-risk areas for wildfire in California alone. This is the highest residential exposure in the country. (Policygenius)
Texas has the highest number of hail damage claims with 637,977 claims between 2017 and 2019. (Policygenius)
Around 85% of homes in the U.S. have a home insurance policy covering them. (ValuePenguin)
79.09% of home insurance policies are for HO-3 policies also known as Broad Form policies. (National Association of Insurance Commissioners, NAIC)
The national average for a home insurance policy is $1,445 annually. (ValuePenguin)
The national average for a home insurance policy for a dwelling worth $250,000 is $1,312 annually. (BankRate)
Nearly half— 47% — of homeowners do not know what their insurance covers. (ValuePenguin)
60% of homeowners undervalue the replacement value of their homes. The average under-evaluation is 17%. (Marshall & Swift/Boeckh)
The amount of net premiums written in 2019 was about $93 trillion. (Statista)
65% of homeowners save on their home insurance policy through bundling discounts— bundling home insurance with auto, RV, or other policies. (J.D. Power)
Home insurance premiums are likely to increase after you experience theft. However, if theft rates are on the rise in your ZIP code, you are likely to see a rise in your home insurance premium even if you have not personally experienced theft loss. (BankRate)
Policy non-renewals have been on the rise in the last two decades. Increased exposure to weather-related risks has been the main driver behind this rise. Legislation and government programs have ameliorated some of the worst effects of non-renewal.
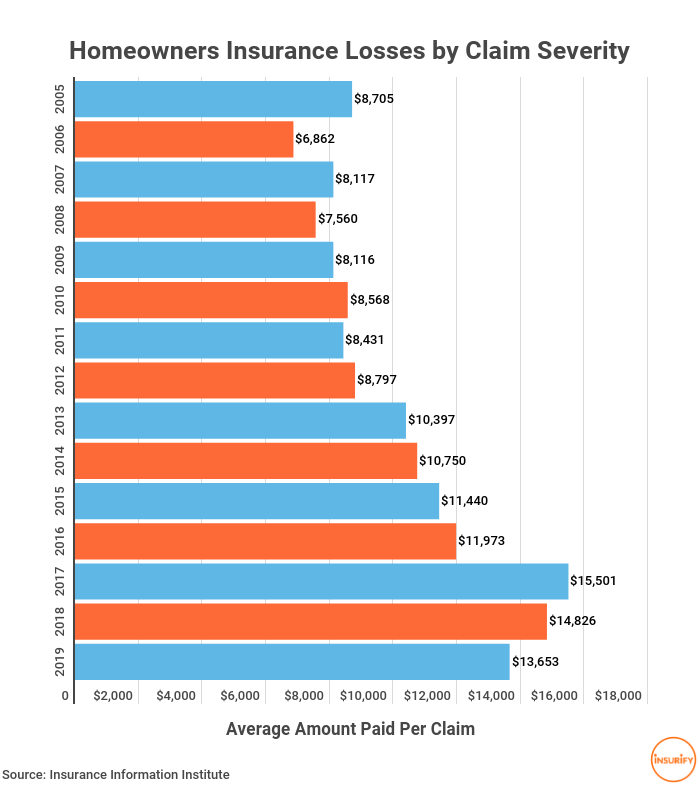
The cost for home insurance has been rising significantly in the last 30 years. It has outpaced inflation consistently.
Homeowners insurance premiums are going up. Premiums rose 1.6% in 2017, then another 3.1% in 2018. (NAIC)
Between 2005 and 2018, the average cost of an annual home insurance premium rose from $764 per year to $1,249 per year. (Statista)
Between 2013 and 2018, the average home insurance premium cost rose by 15%. (ValuePenguin)
Renters insurance premiums are going down. Costs declined by 2.7% in 2017 and then by 0.6% in 2018. (III)
Houses valued at $750,000 cost $2,695 annually on average to insure in 2018. (Statista)
Houses built with brick or masonry framing cost $1,216 to insure annually on average in 2018. (Statista)
The average cost for homeowners insurance from Liberty Mutual in 2018 was $1,216 per year. (Statista)
In the first half of 2020, the property and casualty insurance industry (home, auto, boat, etc.) made a net profit of $27 billion. Though this may seem like a lot, it’s actually a significant decrease from past years— 23% less than the profit in 2019. (NAIC)
The early 2020 decline in profitability is attributed to stock market fluctuations during the beginning of the pandemic. (NAIC)
For multi-peril homeowners insurance policies in 2019, $103,995,754,245 total direct premiums were written. (NAIC)
6 insurance companies comprise 50% of the total property and casualty U.S. insurance market in 2019— a market that includes U.S. territories and Canada. (NAIC)
The top 5 largest insurers comprised 45% of the market in 2019. (ValuePenguin)
Though the group of top insurers have changed over the last seven years, with any given year, the five largest insurers comprise between 45% and 50% of the market. (ValuePenguin)
In 2019, State Farm was the largest insurer both for its market share and number of premiums written. (NAIC)
State Farm is the largest insurer, comprising 17% of the market share of the industry in 2017. Other top insurers include Allstate, Liberty Mutual, and USAA. (Statista)
An insurer’s loss ratio is a great indicator of the company’s financial viability. A ratio greater than 100 indicates that the insurer is paying more in claims than it is taking in with premiums, which is a recipe for poor financial performance. A ratio lower than 60 is a sign of financial strength. (Corporate Finance Institute)
State Farm’s gross direct loss to earned premium ratio was 58.75 in 2019. (BankRate)
In 2019, all of the 6 largest insurers gross direct loss to earned premium ratio was below 60. Farmers Insurance had the most favorable rating at 38.72. (BankRate)
In the first half of 2020, many states saw growth for direct premiums written for homeowners insurance compared to the same period in 2019. (NAIC)
By direct premiums written, State Farm saw the largest increase in 2019 writing about $18.68 billion in premiums. (Statista)
In 2019, Allstate wrote about $8.7 billion in direct premiums for home insurance and accounted for 8.4% of the market share. (Statista)
Liberty Mutual accounted for 6.5% of the market share in 2019. (Statista)
The states with the biggest increase in direct premiums written in the first half of 2020 were: Idaho, Arkansas, Iowa, and Florida. (NAIC)
Several states saw a decline in direct premiums written in the first half of 2020, including New York, Illinois, New Jersey, Hawaii, North Dakota, Delaware, Vermont, and West Virginia. (NAIC)
The net of homeowners reinsurance— insurance that an insurance company purchases from another insurance company to mitigate risk— fell from $56.5 billion in 2017 to $56.2 billion in 2018. (S&P Global Market Intelligence)